The assignment for this module called to explore a dataframe given a set of provided vectors:
"The data set below is based on the presidential election during 2016, where it outlined the name of the candidate, the source of the poll (ABC vs. CBS). Discuss your result in your blog. Important note: I made up this data, so this data does not reflect what really happened in the election."
> Name <- c("Jeb", "Donald", "Ted", "Marco", "Carly", "Hillary", "Bernie")
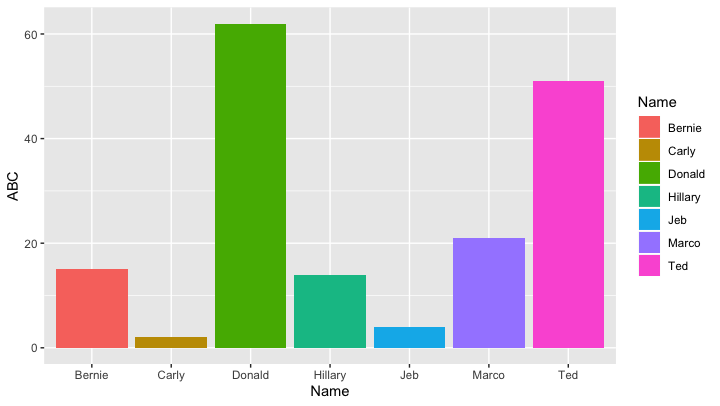
> ABC <- c(4, 62, 51, 21, 2, 14, 15)
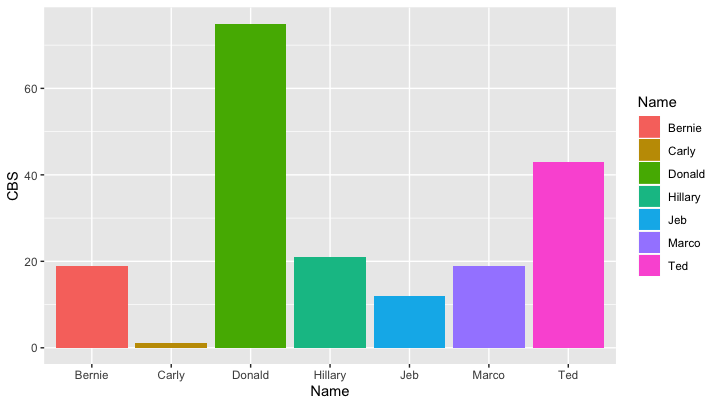
> CBS <- c(12, 75, 43, 19, 1, 21, 19)
By creating, sorting, and plotting the dataframe I was able to explore its contents and see which values stood out the most. Donald clearly had the highest values, while Carly had the lowest poll numbers.