This assignment called to create visualizations in R based off our class lecture pertaining to visualizations in base R, lattice, and ggplot2. From the provided datasets, I chose to explore the "Full Leaf Shape" dataset.
This assignment led me to a few realizations:
- base R visualizations have more flexibility than I originally assumed
- different visualization frameworks use different methods of layering
- each 3 frameworks have strengths and weaknesses, none is objectively "better" than the other
- knowing the data "story" or context makes visualization quicker
- having a definitive goal from the beginning helps make visualization much quicker
Assignment Code
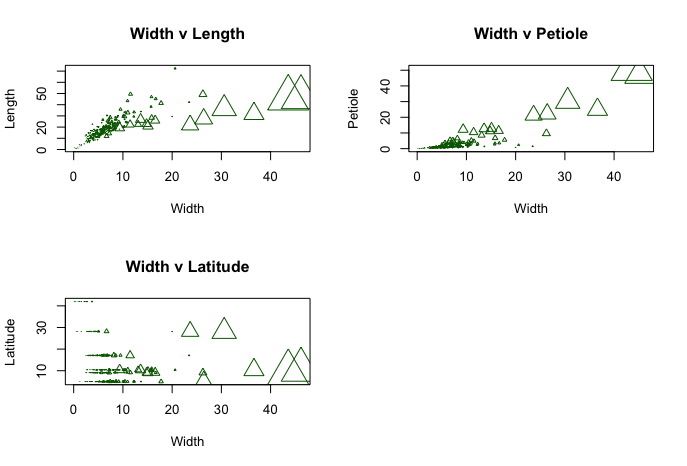
base R Plot
This base R plot surprised me how the basic plot() function could be faceted and detailed with just a few
extra parameters. Here, I reduced the shape size by a factor of 10 to allow for easier viewing. This plot
was effective in helping me understand the relationship between leaf width and length, but neglects a few
significant columns in the dataset such as location.
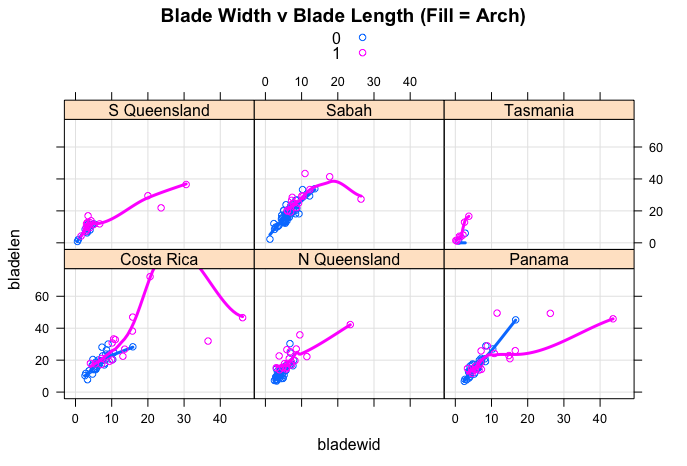
lattice Plot 1
This plot uses lattice and improves upon the previous iteration by now facetting by location. Here, I was also
able to include the "Arch" binary variable and add smoothing lines to more easily see the trends from a glance
between locations.
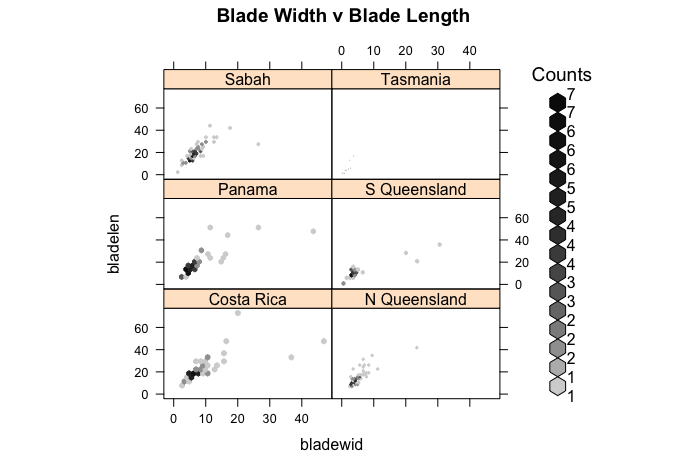
lattice Plot 2
This plot is very similar to the previous lattice plot, however, here I experimented with the hexbinplot package
which was not very beneficial with this plot instance.
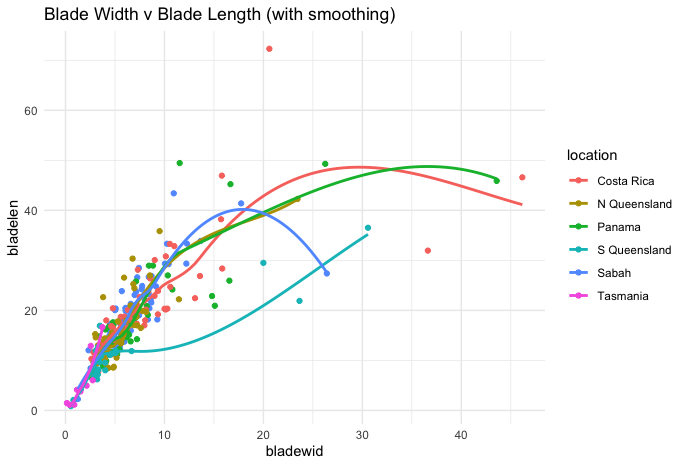
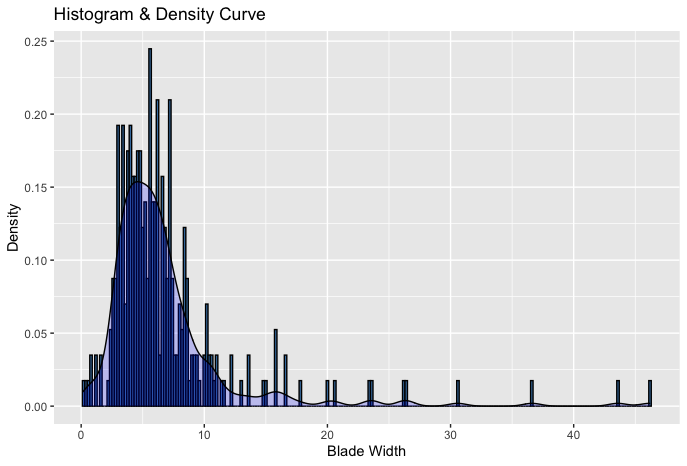
ggplot2 Plot 1
This plot provides a granular look at only leaf blade width. While it does not effectively represent
the whole dataset, it very clearly depicts every aspect of this particular variable. This ggplot2 visualization most
clearly paints a representative picture of blade width compared to any of the previous plots.
ggplot2 Plot 2
This final plot basically combines the base R and lattice plots without the need to facet. While I am particularly biased
in favor of facetting, merging them to 1 singular plot in ggplot2 makes it easier to see the differences
between locations and blade length.